Portal for data center clients
This is a large project that included several stages
- Ticket system and IAAS, admin panel.
- Collocation (BMS)
- Adaptive Design
My role in this project is UX and UI design.
First, after discussing the functionality and viewing similar systems, an information architecture was designed. For this I used Figma. This may not be a very convenient tool for creating information architecture, but Figma is more familiar to me and complies with my requirements.
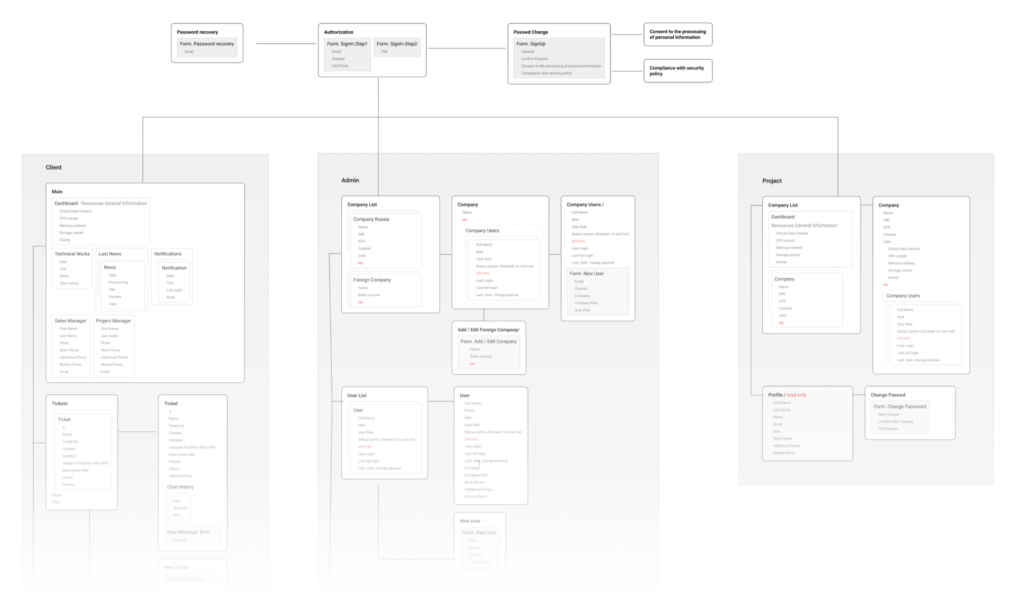
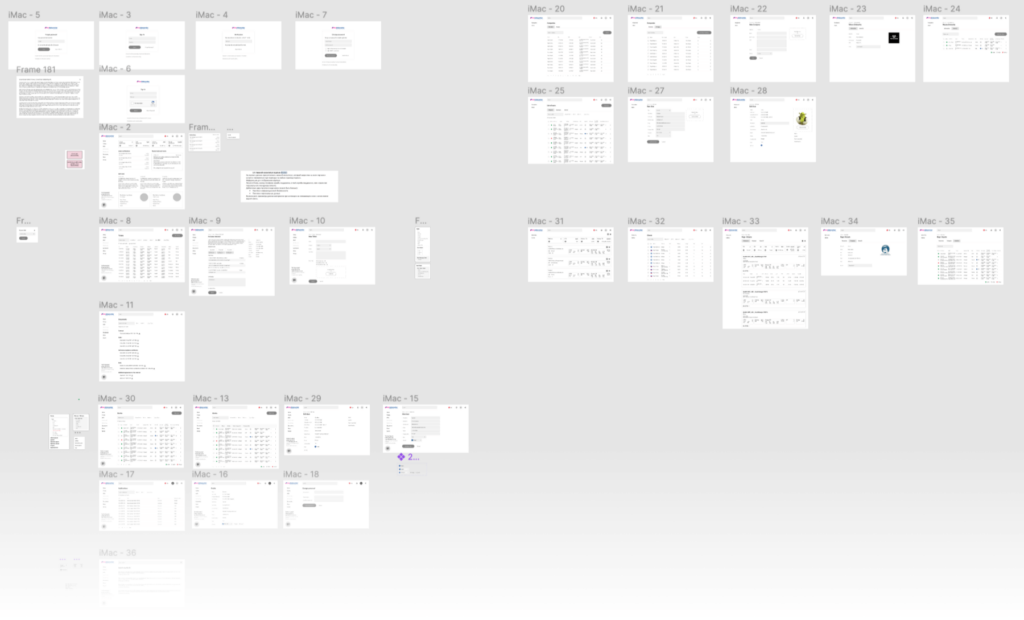
Then a low-fidelity prototype was developed.
Ticket system, IAAS and admin panel
Data center employees have already used the Service Desk. But tickets were created only after the client contacted them via mail or the feedback form on the site. It was necessary to develop a portal on which it was possible to create tickets, comment and evaluate the work of the support service.


IAAS
Based on the user needs, the metrics that the customer needs to track are visualized, and it is also possible to generate reports.


Admin panel
At the time of the creation of the portal, the company had data centers located outside of Russia, so the design was developed in English. This also affected the admin panel, since the set of details for residents and non-residents is different.


BMS
By the time the third stage of design was launched, the design system of the customer had changed. Therefore, I had to modify the ui-kit of the portal. Honestly, the designer of the brand and I got on each other’s nerves, but we managed to agree. It was not justified to completely change the design kit completely when the project was just launched. Only the color solution has been changed.
The section allows customers to track energy consumption, as well as temperature and humidity in the room. You can also track energy consumption for a certain period and upload reports.


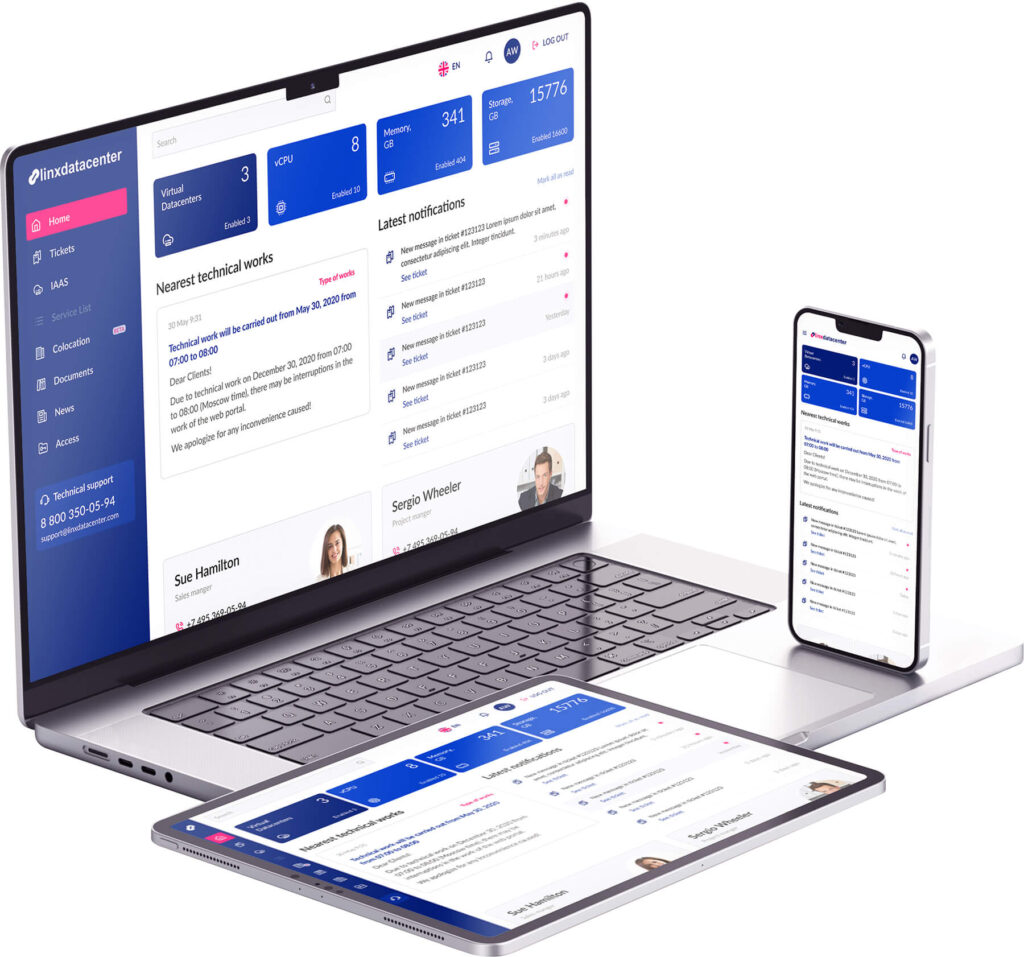
Adaptive design
It’s done. The design was made for several resolutions, it was supposed to choose breakpoints on the example of Airbnb 375 – the minimum resolution, but since I habitually use the 8*8 grid as in the material, I chose 360 as the minimum resolution.
Most of the information is presented in tables, in the future it is possible to use a ready-made framework for the implementation of the data-grid. Perhaps then it will be necessary to update the design kit.